Richard R MeCall, St. Louis College of Pharmacy, St.Louis,Mo
Systematic errors can cause measurements to deviate from the actual value of the quantity being measured.Faulty equipment (such as a meterstick that is not marked correctly)inaccurate calibration of measuring devices (such as a scale to measure mass that has not been properly zeroed) and improper use of equipment by the ex perimenter (such as misinterpreting the range of a voltmeter) are all examples of systematic errors. Some systematìc errors are constantwhereas others are proportional to some quan tìty that changes in the experìment (whether that quantìty ìs being measured or not). Systematìc errors in a varìety oflabo ratory exercises have been described in artìcles in The Physics Teacher.I-8
In our introductory physics labsstudents perform an ex periment that measures pressure beneath the surface of a fluid as a function of depth. A first attempt results in an error of about 10% from the expected value. This sizable error shows up in almost all student-generated data. A close inspection of the experimental apparatus reveals that the depth has been measured incorrectly. When this systematic error is taken into accounta second attempt results in an error ofless than 1%.
Procedure
We connect a pressure sensor (PASCO AbsolutePressure SensorPS-2107)wih an appropriate computer interface (PASCO USB LinkPS-2100A )to a flexible tube whose other end is connected to a glass tube. The glass tube is important for its rigidity because its open end is lowered into a tall graduated cylinder filled with water (see Fig. 1). If using the flexible tube aloneit is difficult to reach the bottom of the cylinder. As the tube is loweredthe pressure beneath the surface of the water pushes on the trapped air in the tube; this pressure is transmitted to the sensorwhere it is measured and recorded.
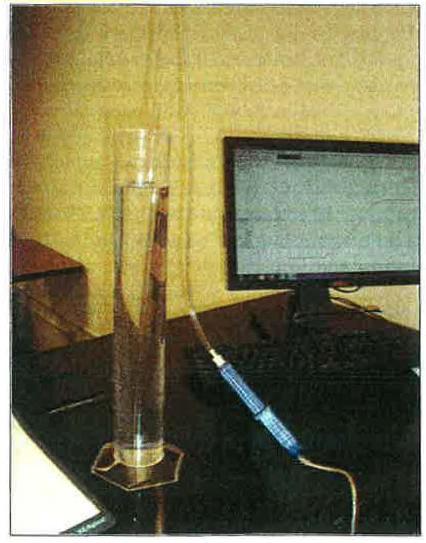
Fig.1.Equipment used in this experiment: pressure sensor and interface with compute flexible tubeglass tubeand graduated cylinder with water. The open end of the glass tube is resting on the bottom of the cylinder.
First attempt
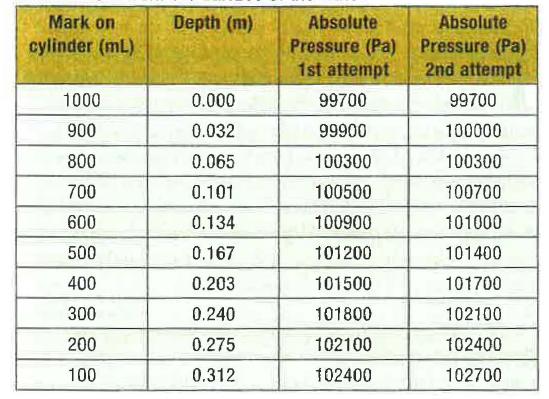
Water is added to the graduated cylinder so that the surface of the water aligns with the l000-mL mark.Starting with the end of the glass tube at this markthe pressure is recorded at the top surface of the water. Then the tube is lowered to the 900-mL mark and the pressure is measured again. The pressure measurement is repeated at the 800-mL markthe 700-mL markand so on until it reaches the 100-mL mark.The depth at each mark is determined by measuring the distance from the top surface (at the 1000-mL mark). Table 1 shows pical experimental values for the first attempt.
When the data are plotted as absolute pressure versus depththe result is a straight line (see Fig. 2blue diamonds). This graph is expected from the formula
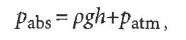
where Pabs is the absolute pressure measured by the pressure sensorp is the density of waterg is the acceleration due to gravityh is the depth of the water measured from the sur- faceand Patm is atmospheric pressure. Using p == 1000 kg/m3 and g == 9.80 m/s2this straight line graph should yield a slope of 9800 Pa/m. Howeverwe see
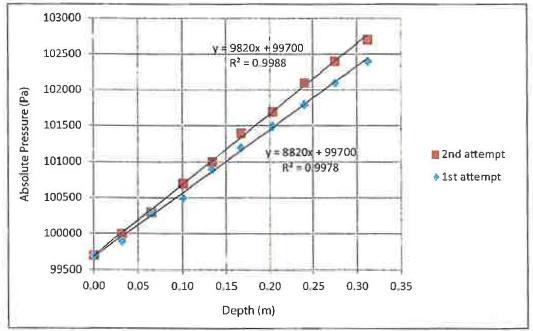
Fig2.A plot of pressure vs depth for the first attempt and the second a empt. (The R2 values are very close to 1 indicating that the trendline is a good fit.)
from the graph that a slope of 8820 Pa/m is foundwhich is an error of 10%.
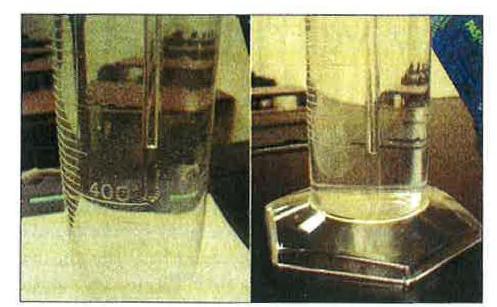
Fig.3.The water level in the glass tube is actually above the lower end of the tube. In the left picture the end is at the 400-mL mark whereas the water level is higher between the 400-mL and the 500-mL marks. In the right picture the end 01the tube is resting on the bottom of the cylinderwith the water level signi1icantly higher near the 100-mL mark.
Observation
Upon doser inspection of the experimental apparatuswe notice that the water level in the tube is actually higher than the end of the tube (see Fig. 3). This feature occurs because the air that is trapped in the tube is subjected to higher pres sures as the tube is lowered in the cylinder. These higher pressures cause the air in the tube to compress to a smaller volumeas expected from Boylelaw (pV = constwhere p is the absolute pressure and V is the volume of the endosed gas). Thuswe learn that the measured values for the depth
are inaccurate because we should be measuring to the level of the water inside the tuberather than to the end of the tube.
Second attempt
1n order to correctly measure the depththe experiment is repeated except this time the water level inside the glass tube is aligned with the marks on the cylinder. Typical values for pressure during this second attempt are shown in the last column ofTable I.
When the absolute pressure values for the second attempt are plo ed in Fig. 2the graph is a straight line with a slope of 9820 Pa/mwhich is much less than 1% error from the theoretical value of9800 Pa/m.
Final thoughts
This experiment has been done in our labs for several years nowand early on it was noted that the results were consistently offby 10% using the method described for the first attempt. The graduated cylinder that was used initially was translucentsuch as high-density polyethylene or poly propyleneso it was difficult to see the water that enters the tube. (1n factwe would take one more measurement with the tube resting on the bottom of the graduated cylinder at the O-mL position!) It didn't take long to discover this situation because we suspected a problem with the experimental design. By making a change to a clear graduated cylinder (we use polymethylpentenebut glass cylinders can be used as well) the level of the water in the glass tube is very noticeable and students are able to observe the proportional nature of this systematic error.
Table 1.Depth and pressure values as the glass tube is lowered into the graduated cylinder. The pressure readings for the first attempt are measured with the lower end of the tube aligned with the marks on the cylinderwhereas the pressure values for the second attempt are measured with the observed water level in the tube aligned with the marks. The depth values are measured to each mark from the surface 01 the water.
Note: There is one other systematic error that occursal- though it does not affect the results in this case. The glass tube used for this experirnent is 6.0 mm in diameter. When lowered to the deepest position in the graduated cylinderthe tube (with the trapped air inside) displaces about 9 mL of water. This displacement causes the water level at the top of the cyl- inder to rise by about 3 mm. When the depth measurements are made taking this rise in water level into accountthe slopes for the first attempt and for the second attempt do not change. A situation where the rise in water level could cause a more significant change would be if a thinner graduated cylinder were used or if a larger diameter tube were usedboth of which would result in a much higher rise in the water level.
References
1. Richard P. McCall "More on systematic error in a Boylelaw experiment;' Phys.Teach.5022-23 (Jan. 2012).
2. Mark E. Rupright"Measuring systematic error with curve fits; Phys. Teach. 4954-55(Jan. 2011).
3. Franklin Miller "Two kinds of electrons;' Phys. Teach. 45 210-216 (April2007).
4. Paul Beeken"Ball on the edge;' Phys. Teach.42366-368 (Sept. 2004).
5. Mark L.Biermann and Nicholas A. Nelson"Usìng the GPS to determine the size of the Earth;' Phys. Teach. 38,360-361 (Sept.2000).
6. Robert Ehrlich and Mary Lynn Hutchison"Random and systematic errors ìn tìming the fall of a coin;' Phys. Teach.32 51-53(Jan. 1994).
7. Santos A. Ramirez and Joe S. Ham"Systematic errors in an air track experiment;' Phys. Teach.28602-603 (Dec. 1990).
8 Roger Blickensderfer"Systematic errors and graphical extrapolatio :'Phys.Teach. 23545-547 (Dec. 1985).